Measurement of wall shear stress in wind-blown sand environment
-
摘要: 地表剪切力是风沙运动的关键驱动力,在风沙运动研究中非常重要,但目前针对风沙流环境地表剪切力的实验测量却较为匮乏,已经成为风沙运动研究深入发展的瓶颈。本文介绍了一种基于热膜技术的适用于风沙流环境地表剪切力精确测量的方法,使用热膜传感器和二维热线探头对净风条件下的地表剪切力进行了测量,结果显示:热膜传感器对地表剪切力有较好的响应,其与二维热线探头对摩阻风速的测量结果相差小于6.6%。热膜传感器对方柱绕流条件下地表剪切力的测量结果与OpenFOAM数值模拟结果具有较好的一致性,进一步证明了热膜传感器测量地表剪切力的可行性。热膜传感器的沙粒撞击实验结果表明:沙粒撞击对热膜信号的影响可以忽略,在风沙流环境中可以采用热膜传感器对地表剪切力进行有效测量。基于该技术测量了风沙流环境地表剪切力沿流向的空间分布特征,采用实测方式获得了风沙流环境地表剪切力的空间分布规律。Abstract: As a key driving force of aeolian sand movement, wall shear stress is of importance in the study of aeolian sand movement. However, at present, the experimental measurement of the surface shear force in the wind-blown sand environment is extremely scarce, which has become a bottleneck for the further development of the wind-blown sand research. This paper introduces a method based on the hot-film technology for accurate measurement of the wall shear stress in the wind-blown sand environment. The wall shear stress was measured under conditions without sand using hot-film probes and two-dimensional hot-wire probes, respectively. The result shows that the hot-film probe has a good response to the wall shear stress, and the difference between the measurement results of the friction velocity of these two probes is less than 6.6%. The measurement results of the hot-film probe for the wall shear stress of flow around the square column are in good agreement with the OpenFOAM numerical simulation results, which further proves the effectiveness of the hot-film probe for the measurement of the wall shear stress. In addition, the particle impact test results of the hot film probes show that the influence of particle impact on the hot-film signal is negligible, so the hot-film probe can be used to effectively measure the wall shear stress in the wind-blown sand environment. Based on this technology, the spatial distribution characteristics of the wall shear stress along the flow direction in the wind-blown sand environment were tested. And for the first time, the spatial distribution of the wall shear stress in the wind-blown sand environment was obtained by means of actual measurement. In view of the high-frequency response capability of the hot-film probe, this technology will play an important role in the experimental research on the mechanism of aeolian sand movement in the turbulent boundary layer.
-
Keywords:
- hot-film probe /
- wind-blown sand /
- wall shear stress /
- two-dimensional hot-wire probe
-
0 引 言
风沙运动是一种对人类生活影响巨大的极端环境,不但会破坏建筑、道路等人工设施,还会严重影响人类健康,每年都会造成巨大的经济损失[1]。在风沙物理学中,风沙运动可分为沙粒释放、沙粒输运、沙粒沉降等3个力学过程[2],这些过程都与地表剪切力τ联系密切(在流体力学中,地表剪切力通常表示为摩阻风速u*的函数:τ = ρu* 2)。在纯流体中,研究者已经针对不同尺度湍流结构、雷诺数及地表粗糙度条件下的地表剪切力平均值和脉动值变化情况开展了充分的理论和实验研究[3-4];而在气固两相流中,由于测量技术的限制,关于地表剪切力的研究主要针对平均值$\bar \tau $,对脉动值的研究则相对较少[5-8]。
近年来,研究者开始认识到地表剪切力脉动值对风沙流中沙粒的影响不能忽略[9-10]。在沙粒起动方面,通过风沙流环境野外实验研究发现:真实风沙运动中的沙粒起动具有间歇性[11-12],单纯的地表剪切力平均值不能很好地反映间歇性现象,对输沙率预测会产生影响。在沙粒输运方面,研究者对跃移输沙通量(工程与科学研究共同关注的重要宏观物理量)进行了深入研究,针对不同工况及环境得到了一系列输沙率公式[13-15]。通过对比研究发现,输沙率与摩阻风速的三次方成正比,两者之间存在密切的联系。对于这种非线性关系,平均值显然不能很好地反映输沙率的变化。另外,在野外环境下,由温度的日变化等带来的风速剧烈变化会导致地表剪切力平均值的研究价值降低。例如,对于地表加热不均匀而产生的尘卷风,地表剪切力平均值就无法真实反映其内在机理。在沙粒沉降方面,沉降末速度是一个重要参数,会对沉积通量产生影响。通过对几种沉积方案的研究发现:地表剪切力对沉降末速度存在重要影响[16-17]。同样,由于沉降末速度与摩阻风速之间的非线性关系,基于地表剪切力平均值的研究可能不足以实现对沉积通量的准确估计。
测量风沙流中的地表剪切力脉动时间序列,对于风沙物理研究具有重要意义。研究者针对风沙流环境地表剪切力已经进行了大量测量。在环境复杂恶劣的野外实验中,一般使用三维超声风速仪测量风速,进而推导出地表剪切力。而在风洞实验中,由于空间分辨率不足,无法使用超声风速仪精确测量地表剪切力脉动时间序列。针对这一问题,Irwin模仿普雷斯顿管式表面摩擦计[18]发明了Irwin探头[19],其测量基于垂直于地表的探头细管顶端与地表之间压差是摩阻风速的指数函数的原理,通过测量压差即可得到摩阻风速。在测量风沙流环境地表剪切力平均值的实验中,Irwin探头的表现令人满意;但由于其测量的是近地表不同高度处通过气体传播的压差,压力信号存在延迟,使得Irwin探头对地表剪切力的瞬时响应速度较低。经过多年发展,基于电信号的测量手段逐渐发展成熟。其中,热膜传感器的测量精度得到明显提升,已经广泛应用于飞行器、潜水器的表面阻力测量[20-24]。带有保护层的热膜传感器抗干扰能力更强,对沙粒撞击具有一定抵挡作用,在气固两相流地表剪切力测量中应用潜力较大。
本文通过实验验证热膜地表剪切力测试仪的测量精度,评估其在风沙流环境下的表现及风沙流对热膜传感器的影响。通过风洞实验,测量方柱绕流分离区内的地表剪切力空间分布情况,并与数值模拟结果进行对比,验证热膜传感器测量复杂流场环境下地表剪切力的准确性。
1 测量原理简介
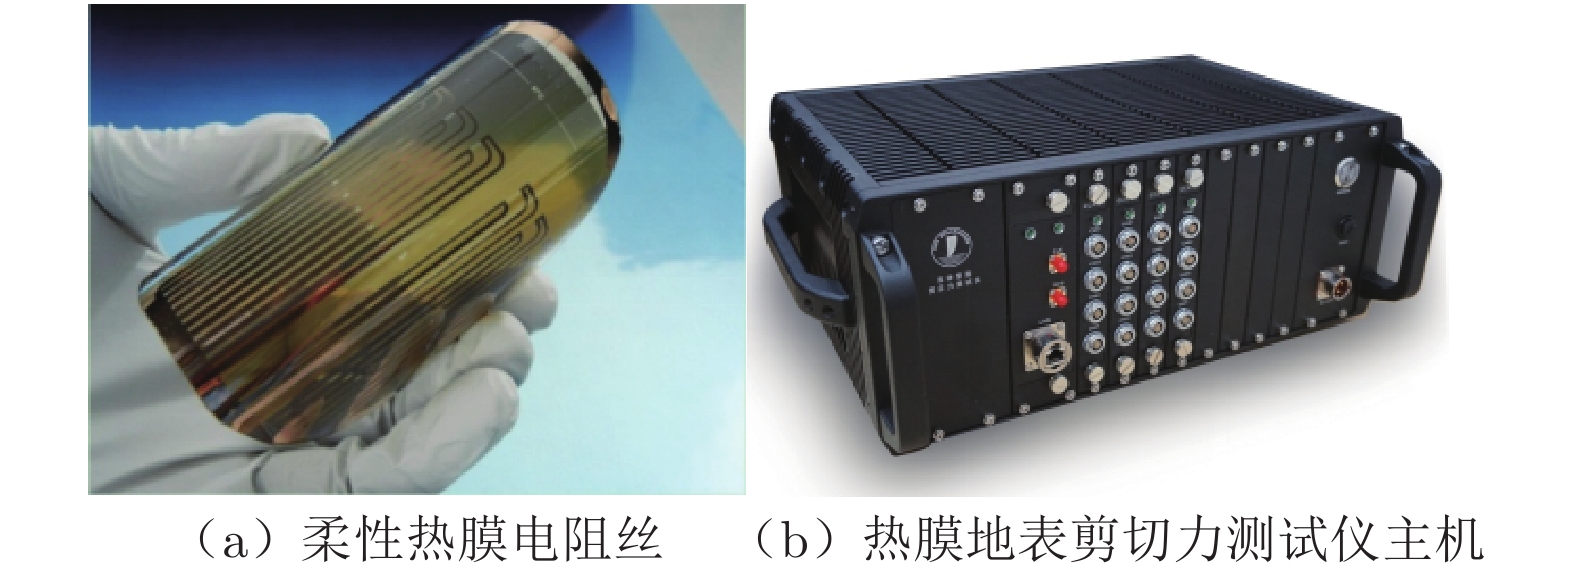
以热膜传感器测量地表剪切力,是通过测量壁面与流体之间的热传导实现的。使用热膜传感器需满足3个前提条件:1)热膜传感器足够薄且紧贴被测对象表面,其对流场的影响可以忽略;2)工作温度低于100 ℃,可忽略辐射传热,且不会对流体性质及流动特性造成影响;3)热膜传感器的发热单元在流向上足够短,其产生的温度边界层厚度δT远小于速度边界层厚度δ。本文使用的热膜传感器以聚酰亚胺箔(PI)作为基板,将1 μm热敏镍(Ni)磁控溅射于PI箔上,再采用光刻及湿法蚀刻工艺将传感器元件进行图案化。传感元件长3 mm,宽50 μm,热膜总厚度不超过80 μm。该传感器的有效响应频率可达到4 kHz,结合风沙流研究特点及实际测量环境,将测试频率设置为2 kHz,该频率已足以反映测量过程中风沙流环境下地表剪切力的相关信息。热膜装置如图1所示。
1.1 热膜传感器标定关系
以二维定常流为例推导标定关系式。式(1)和(2)分别为层流边界层微分方程和能量积分方程:
$$ \rho u\frac{{\partial u}}{{\partial x}} + \rho \upsilon \frac{{\partial v}}{{\partial y}} = - \frac{{{\rm{d}}p}}{{{\rm{d}}x}} + \mu \frac{{{\partial ^2}u}}{{\partial {y^2}}} $$ (1) $$ \frac{{\rm{d}}}{{{\rm{d}}x}}\int_0^\infty {u\left( {T - {T_\infty }} \right)} {\rm{d}}y = - \frac{k}{{\rho {C_p}}}{\left( {\frac{{\partial T}}{{\partial y}}} \right)_{\rm{w}}} $$ (2) 式中:k为热传导系数;Cp为定压比热;T为传感器温度,T∞为来流温度;p、ρ分别为流体压力和密度;u、v分别为流向速度、垂向速度;υ、μ分别为运动黏性系数、动力黏性系数;下标w表示物理量在壁面处的值。由前述第3个前提条件(即δT $\ll $ δ),可将式(1)简化为:
$$ \mu \frac{{{\partial ^2}u}}{{\partial {y^2}}} = \frac{{{\rm{d}}p}}{{{\rm{d}}x}} $$ (3) 对式(3)积分,代入边界条件y = 0和τ = τw(τw表示高度为0时地表剪切力的边界条件)可得:
$$ u = \frac{{{\tau _{\rm{w}}}}}{\mu }y + \frac{1}{{2\mu }}\frac{{{\rm{d}}p}}{{{\rm{d}}x}}{y^2} $$ (4) 将式(4)代入式(2)可得:
$$ \begin{split}&\frac{{\rm{d}}}{{{\rm{d}}x}}\left[ {{\tau _{\rm{w}}}\int_0^\infty y(T - {T_\infty }){\rm{d}}y + \frac{1}{2}\frac{{{\rm{d}}p}}{{{\rm{d}}x}}\int_0^\infty {{y^2}(T - {T_\infty }){\rm{d}}y} } \right] \\&\qquad = \frac{{{\mu ^2}}}{{\rho kPr}}{q_{\rm{w}}}(x)\end{split} $$ (5) 式中,Prandtl数Pr = Cpμ/k,热膜单位面积热传导率$q_{\mathrm{w}}(x)=-k(\partial T / \partial y)_{\mathrm{w}} $。式中积分可用Curle法求解。假设:
$$ T - {T_\infty } = ({T_{\rm{w}}} - {T_\infty })f(\eta ) $$ (6) 式中,Tw为y = 0时的温度值。由δT $\ll $ δ可得:
$$ f(\eta ) = (1 - 4{\eta ^3} + 3{\eta ^4}) + \lambda (\eta - 3{\eta ^3} + 2{\eta ^4}) $$ (7) 其中,高度的无量纲值η = y/δT和λ = −qwδT/k(Tw − T∞)为温度边界层的形式参数。由式(6)和(7)可得式(5)的第一个积分结果为:
$$\begin{split}& \int_0^\infty {y(T - {T_\infty })} {\rm{d}}y = \int_0^1 {\eta \delta _{{T}}^2} ({T_{\rm{w}}} - {T_\infty })f(\eta ){\rm{d}}\eta \\&\qquad =a{k^2}{({T_{\rm{w}}} - {T_\infty })^3}/q_{\rm{w}}^3(x) \end{split} $$ (8) 式中,$a = {\lambda ^2}\displaystyle\int_0^1 {{\eta ^2}} f(\eta ){\rm{d}}\eta $。同理可得第二个积分结果为:
$$ \begin{split}& \int_0^\infty {{y^2}(T - {T_\infty })} {\rm{d}}y = \int_0^1 {{\eta ^2}\delta _{{T}}^3} ({T_{\rm{w}}} - {T_\infty })f(\eta ){\rm{d}}\eta \\&\qquad = - b{k^3}{({T_{\rm{w}}} - {T_\infty })^4}/q_{\rm{w}}^3(x) \end{split} $$ (9) 式中,$b = {\lambda ^3}\displaystyle\int_0^1 {{\eta ^2}} f(\eta ){\rm{d}}\eta $。将上述积分结果代入式(5)可得:
$$ \begin{split}&\frac{{\rm{d}}}{{{\rm{d}}x}}\left[ {\frac{{a{k^2}{\tau _{\rm{w}}}{{({T_{\rm{w}}} - {T_\infty })}^3}}}{{q_{{\rm{w}}}^2(x)}} - \frac{{b{k^3}{{({T_{\rm{w}}} - {T_\infty })}^4}}}{{2q_{{\rm{w}}}^3(x)}}\frac{{{\rm{d}}p}}{{{\rm{d}}x}}} \right] \\& \qquad = \frac{{{\mu ^2}}}{{\rho kPr}}{q_{\rm{w}}}(x) \end{split}$$ (10) 假设Tw和qw为x的阶跃函数,可以得到:
$$ a{k^2}{\tau _{\rm{w}}}{\left(\frac{{\Delta T}}{{{Q_{\rm{w}}}}}\right)^3} - \frac{1}{2}b\frac{{{\rm{d}}p}}{{{\rm{d}}x}}{k^3}{\left(\frac{{\Delta T}}{{{Q_{\rm{w}}}}}\right)^4} = \frac{{{\mu ^2}L}}{{\rho kPr}} $$ (11) 式中:L为热膜的有效长度;Qw为热膜与流体之间传递的总热量;ΔT为来流温度与壁面温度差值。假设静压梯度很小,即dp/dx ≈ 0,可将式(11)简化为:
$$ \tau _{\rm{w}}^{1/3} = {\left( {\frac{{{\mu ^2}L}}{{a\rho {k^3}Pr}}} \right)^{1/3}}\frac{{{Q_{\rm{w}}}}}{{\Delta T}} $$ (12) 式中,Qw等于热膜电阻发热产生的热能I2R减去壁面热损失Q',则式(12)可写作:
$$ \tau _{\rm{w}}^{1/3} = {\left( {\frac{{{\mu ^2}L}}{{a\rho {k^3}Pr}}} \right)^{1/3}}\frac{{{I^2}R}}{{\Delta T}} - {\left( {\frac{{{\mu ^2}L}}{{a\rho {k^3}Pr}}} \right)^{1/3}}\frac{{{Q'}}}{{\Delta T}} $$ (13) 以上推导过程中使用了若干假设,且风洞实验中难以测量地表的热损失,因此通过式(13)无法直接得出地表剪切力,需通过实验进行标定。根据式(13),假设标定关系为如下形式:
$$ \tau _{\rm{w}}^{1/3} = {A_1}\frac{{{I^2}R}}{{\Delta T}} + B $$ (14) 式中,A1和B为标定时需确定的参数。实际上,热膜地表剪切力测试仪的工作原理与恒温式热线风速仪相同,通过测量电桥电压得到τw,此时Tw为恒定值。若来流温度T∞的变化忽略不计,则式(14)可写作:
$$ \tau _{\rm{w}}^{1/3} = {A_2}{E^2} + B $$ (15) 式中:A2为标定参数;E为电桥电压,即式(14)中I2R。在实际测量中,一般采用如下形式:
$$ E_0^2 - E_{\rm{w}}^2 = A\tau _{\rm{w}}^{1/3} + B $$ (16) 式中,E0为无风状态下电桥电压读数,A和B为标定参数。
2 热膜地表剪切力测试仪的标定和实验验证
在航天飞行器、潜艇等测量环境下,热膜地表剪切力测试仪的准确性已经得到证实[20-24],但在风沙流环境的恶劣条件下,其准确性仍需进一步验证。本文对热膜传感器进行了标定,通过风洞实验验证其测量结果的准确性,同时验证其在承受沙粒撞击过程中工作的稳定性。
2.1 实验布置
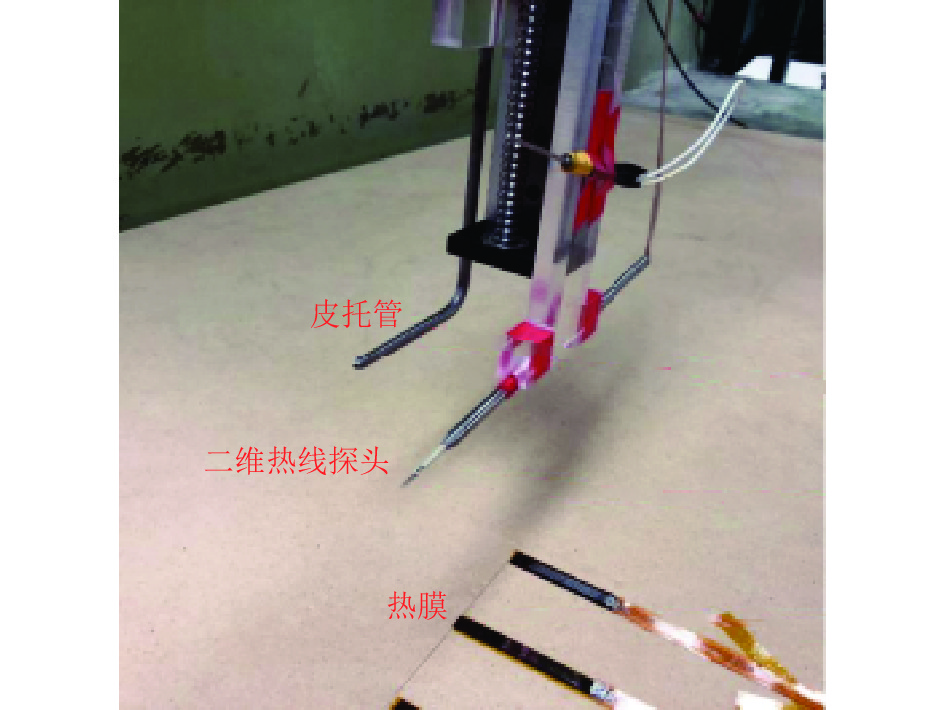
如图2所示,在风洞实验段铺设木板,形成光滑平坦地表,以进行标定和测试实验。在地表上方相同高度布置皮托管和二维热线探头,并将两者安装于移动坐标架上,以测量不同高度处的流动信息。在地表沿流向布置3个热膜传感器,探头间距5 cm。对皮托管、二维热线探头和热膜传感器进行同步观测,热膜传感器的采样频率为2 kHz,采样时间为3 min。
2.2 热膜传感器与热线探头测量结果对比
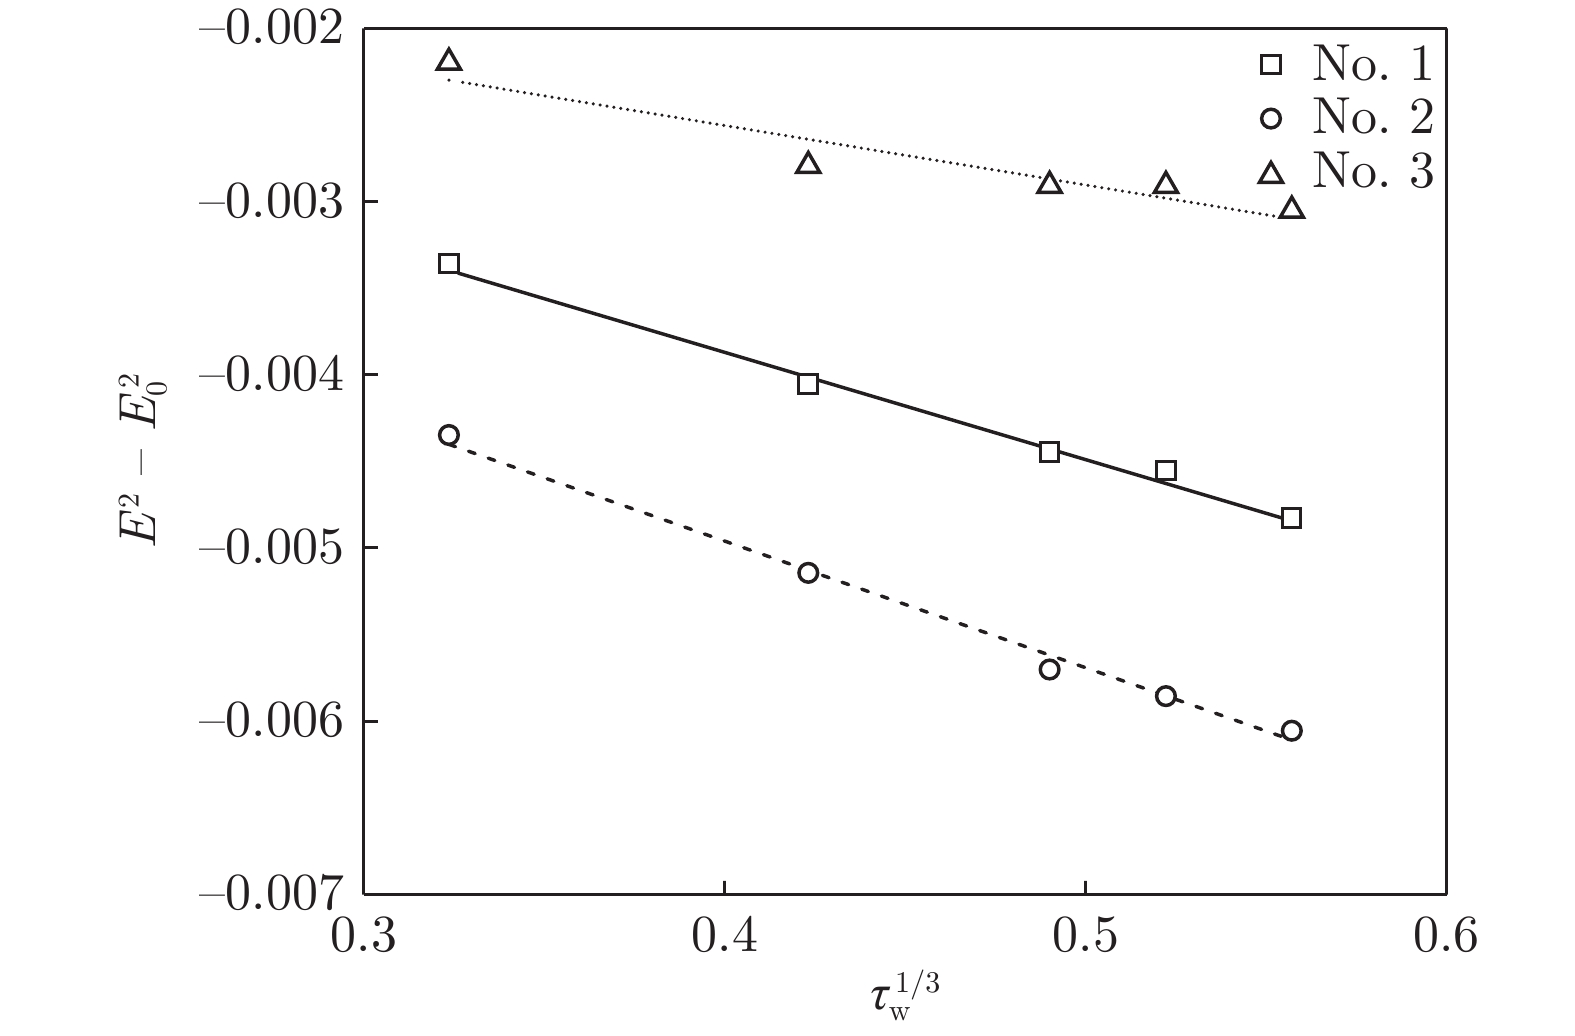
在风沙流环境下,对仪器抗干扰能力有着较高要求,因此需对热膜传感器的测量精度进行验证,并评估风沙中运动沙粒对热膜测量结果的影响程度。实验中,以皮托管测量风速廓线,并通过壁面率计算出5种不同风速下的地表剪切力,与热膜传感器测量结果进行对比,最终完成标定。图3为实验中3个热膜传感器(No. 1 ~ No. 3)在5种不同风速下的标定结果,同时还使用式(16)进行了线性拟合。
![]() 图 3 不同风速下热膜传感器的标定结果Fig. 3 Calibration results of hot-film probes at different velociies
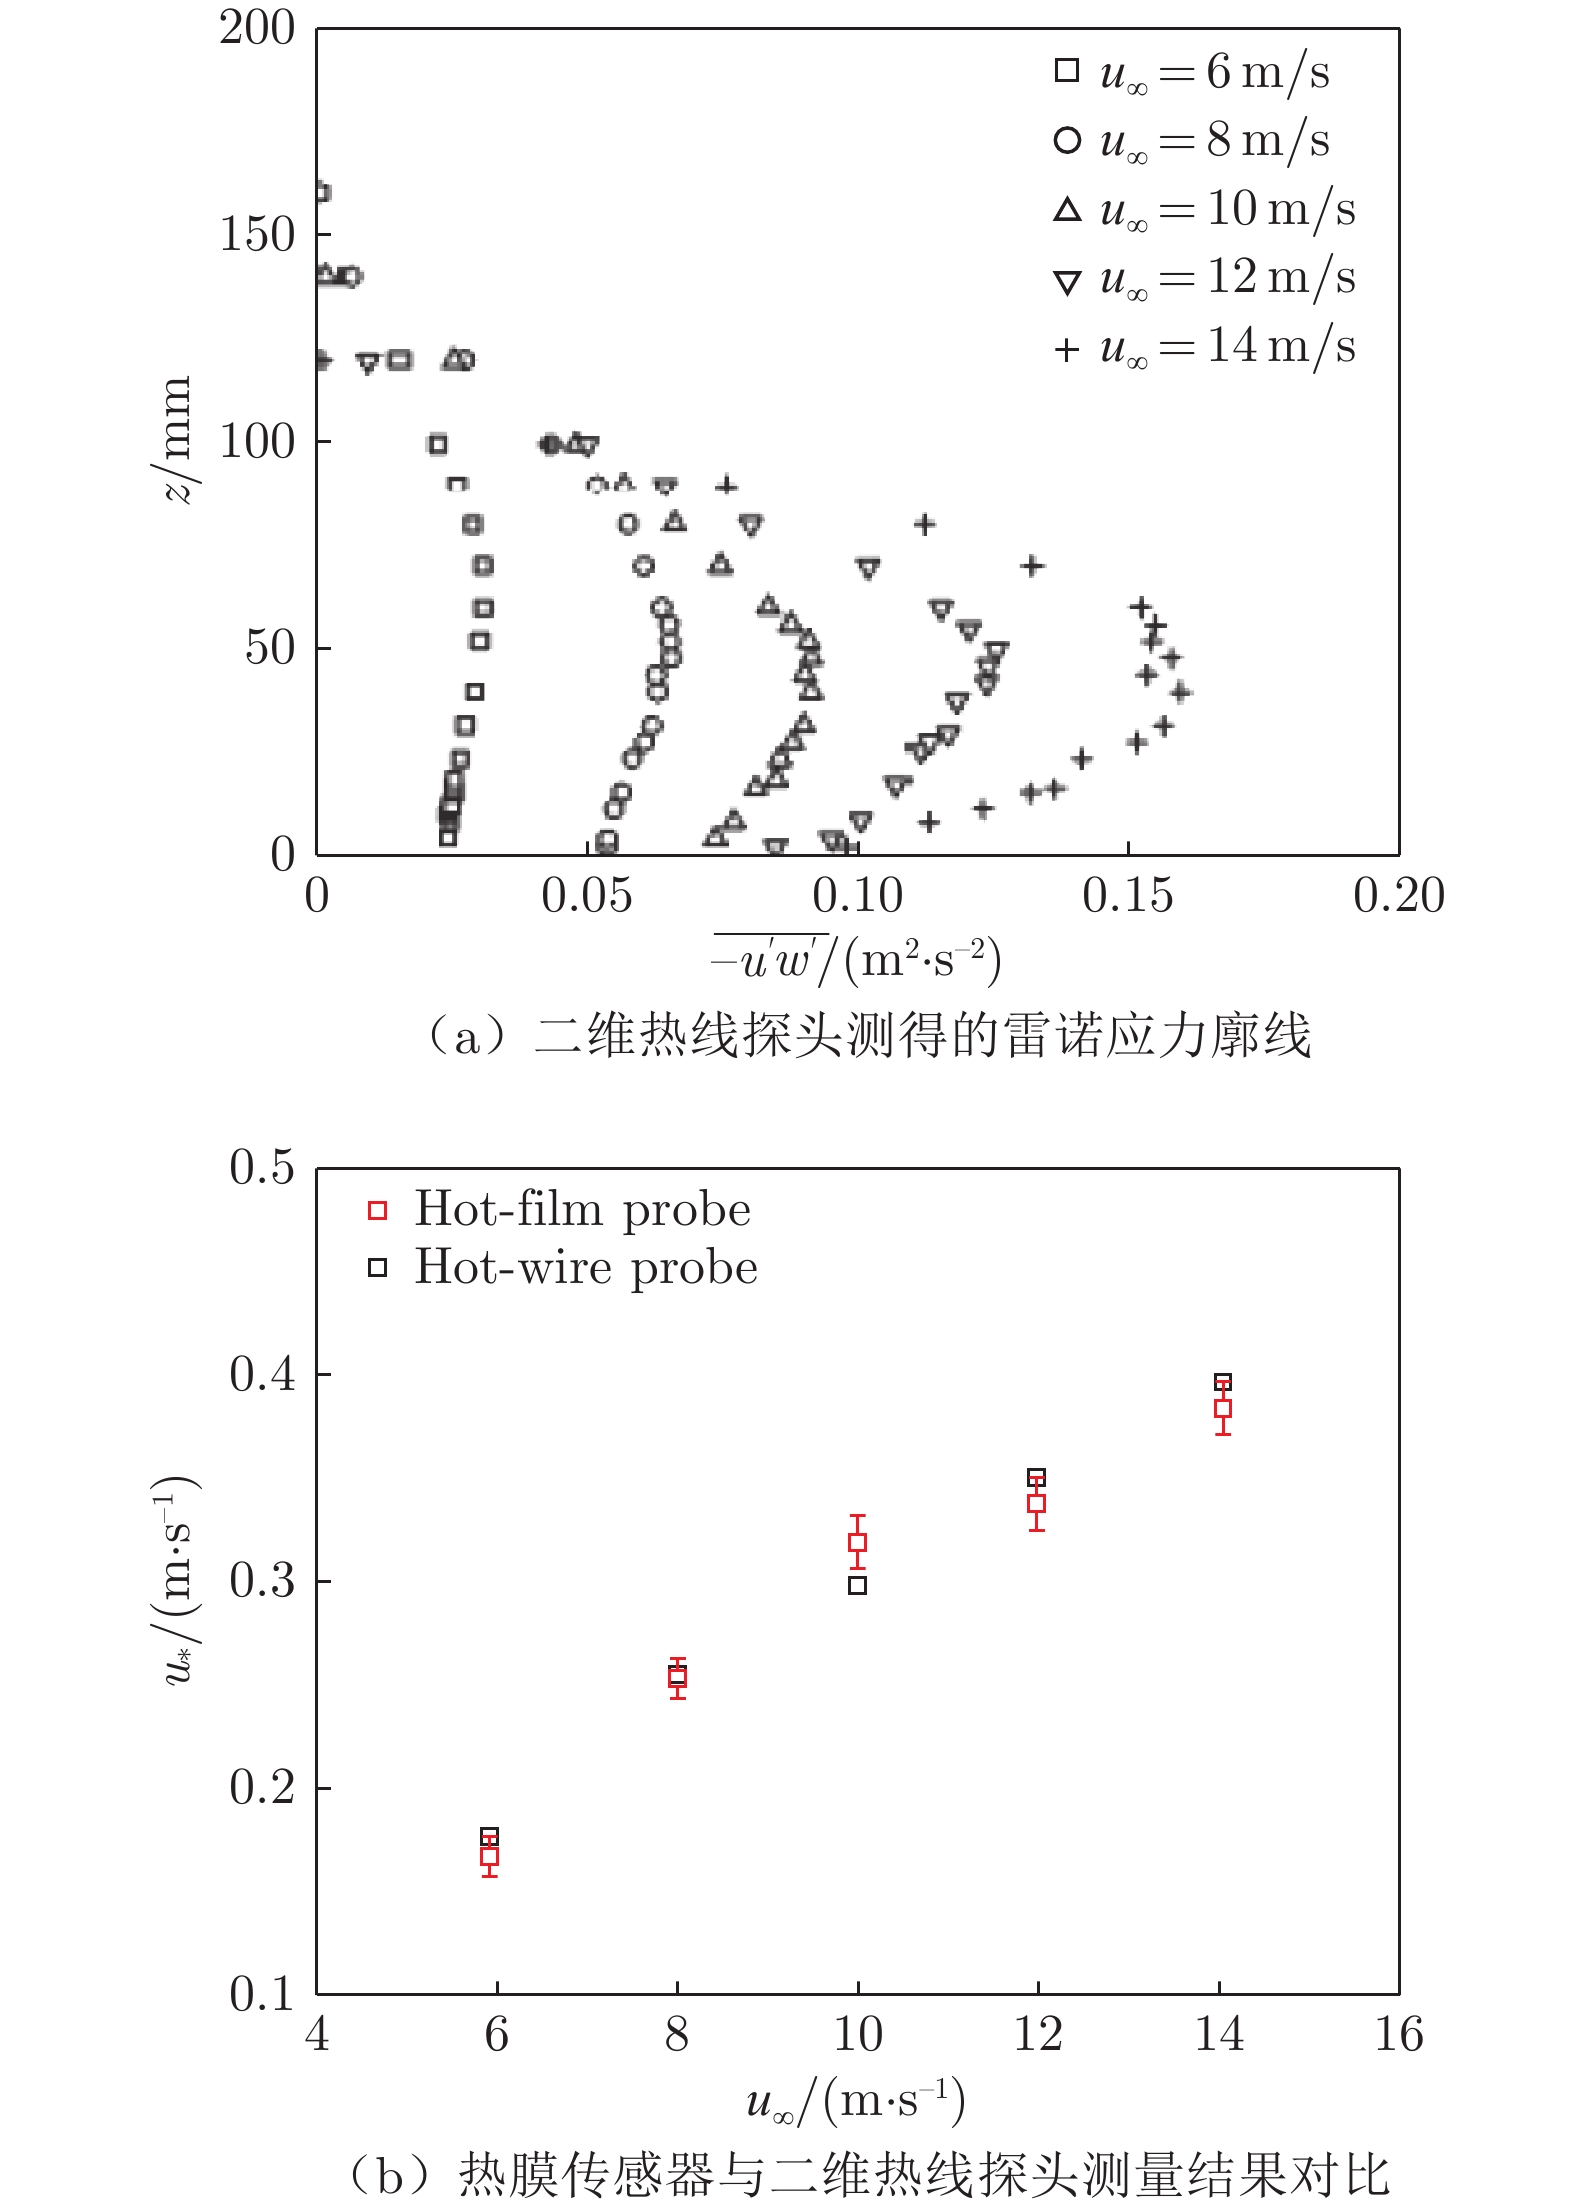
图 3 不同风速下热膜传感器的标定结果Fig. 3 Calibration results of hot-film probes at different velociies完成标定之后,还需对热膜传感器的测量结果进行验证。图4(a)为二维热线探头测量的不同高度处的雷诺应力−$\overline {u'w'} $(u'、w'分别为流向瞬时脉动风速、垂向瞬时脉动风速;图中u∞为来流速度)。随着高度z增大,雷诺应力先增大后减小,摩阻风速由$\overline {u'w'} $的峰值确定[25]。图4(b)为热膜传感器与二维热线探头的摩阻风速u*测量结果的对比,从图中可以看出,两者之间的测量误差在0.7% ~ 6.6%之间。
由图4可知,热膜传感器对地表剪切力的测量结果是准确的。进一步地,对其在风沙流环境下的工作表现进行验证。为评估沙粒撞击对热膜传感器测量结果的影响程度,在无风状态下以沙粒撞击热膜传感器。图5(a)为沙粒撞击产生的噪声信号与实际风场测量中输出信号的对比(图中e0 = $E_0^2$),可以发现,沙粒撞击对信号的影响远小于信号本身的波动。图5(b)为3种风速下沙粒撞击产生的噪声信号与实际风场测量中输出信号的比值(图中ew = $E_{\rm{w}}^2$)。经对比发现,沙粒撞击产生的噪声信号比实际测量的信号低一个数量级。因此,在风沙流环境中,沙粒撞击引入的信号噪声相当小。
![]() 图 5 沙粒撞击对热膜传感器测量结果的影响Fig. 5 Effect of particle impact on measurement results of hot-film probe
图 5 沙粒撞击对热膜传感器测量结果的影响Fig. 5 Effect of particle impact on measurement results of hot-film probe3 热膜测量结果与数值模拟对比
为进一步验证热膜传感器的测量精度,本节以方柱绕流算例结果与热膜传感器测量结果进行对比。方柱扰流实验设置如图6所示,在热膜传感器上游布置一个方柱(5 cm × 5 cm × 10 cm)。实验中,改变方柱与热膜传感器之间的距离,在方柱的每个位置上测量3 min,对测量结果进行时间平均,即可得出方柱后方地表剪切力平均值随方柱与热膜传感器之间距离的变化情况。
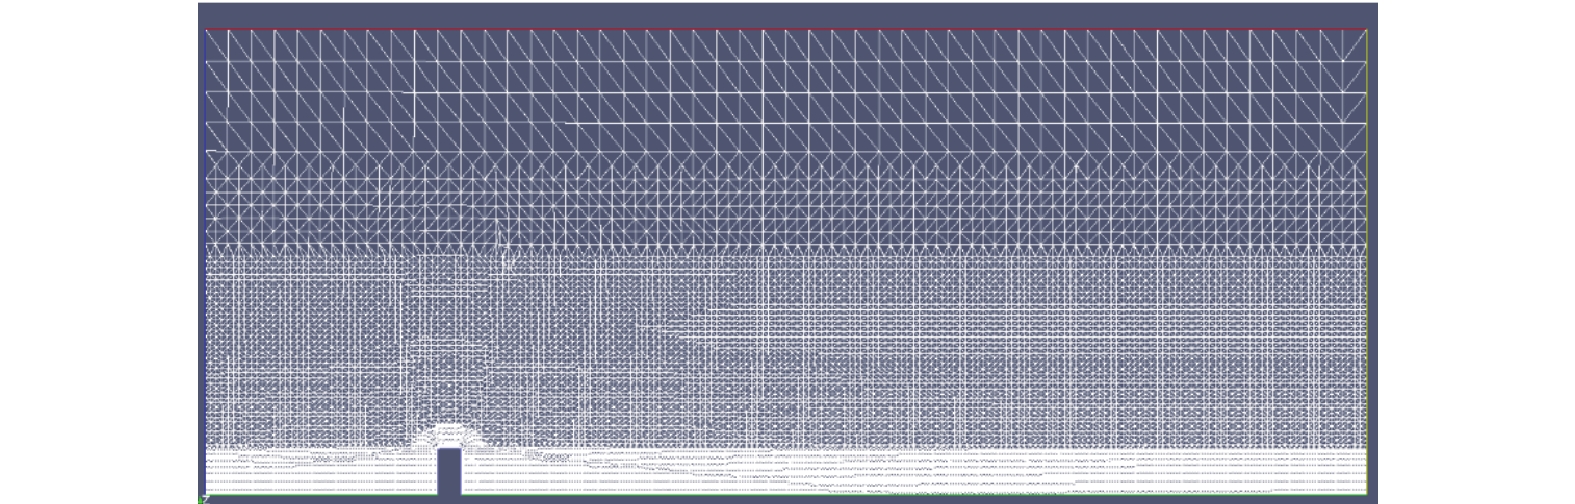
针对上述实验工况,基于OpenFOAM开源代码中求解不可压缩流体的瞬态求解器进行了数值模拟。数值模拟的计算域和网格划分如图7所示,计算域设置为1.0 m × 1.0 m × 2.5 m,在地表和方柱附近进行了网格加密。设置入口风速u∞ = 12 m/s,计算时长为25 s。湍流模型为IDDES(k–ω Shear Stress Transport (SST)–Improved Delayed Detached Eddy Simulation),该模型被广泛应用于复杂流场的湍流计算,准确性已经得到验证。
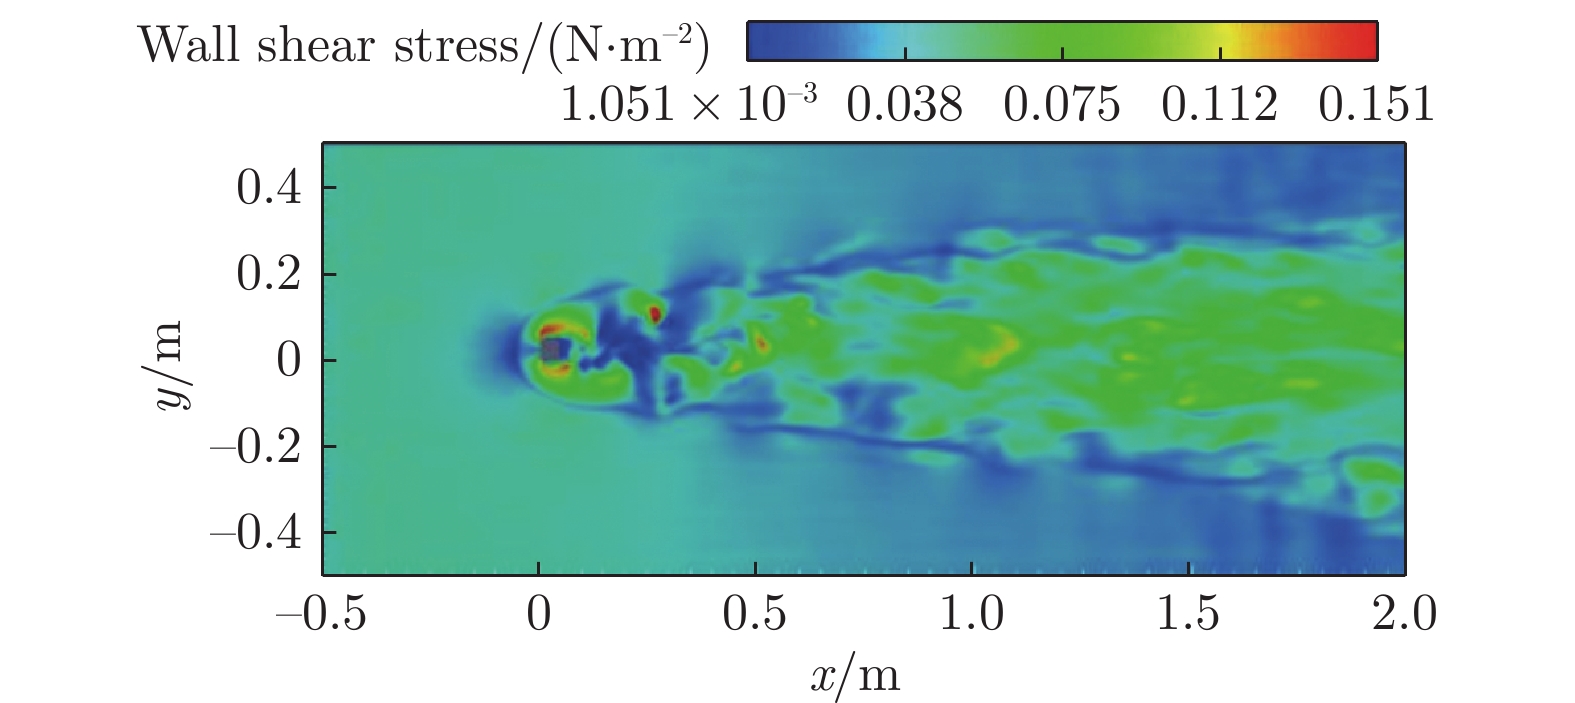
在求解湍流过程中,近壁面区域使用RANS模型进行计算,远离壁面区域则使用LES模型,以尽量确保数值模拟的准确性。图8为方柱绕流的地表剪切力云图(x、y分别为流向和展向坐标),从图中可以清晰分辨出方柱后方的湍流结构。数值模拟能够较为精确地反映方柱后方的地表剪切力变化情况,从而对风洞实验结果进行验证。
![]() 图 8 数值模拟中的地表剪切力分布Fig. 8 Spatial distribution of wall shear stress in numerical simulation
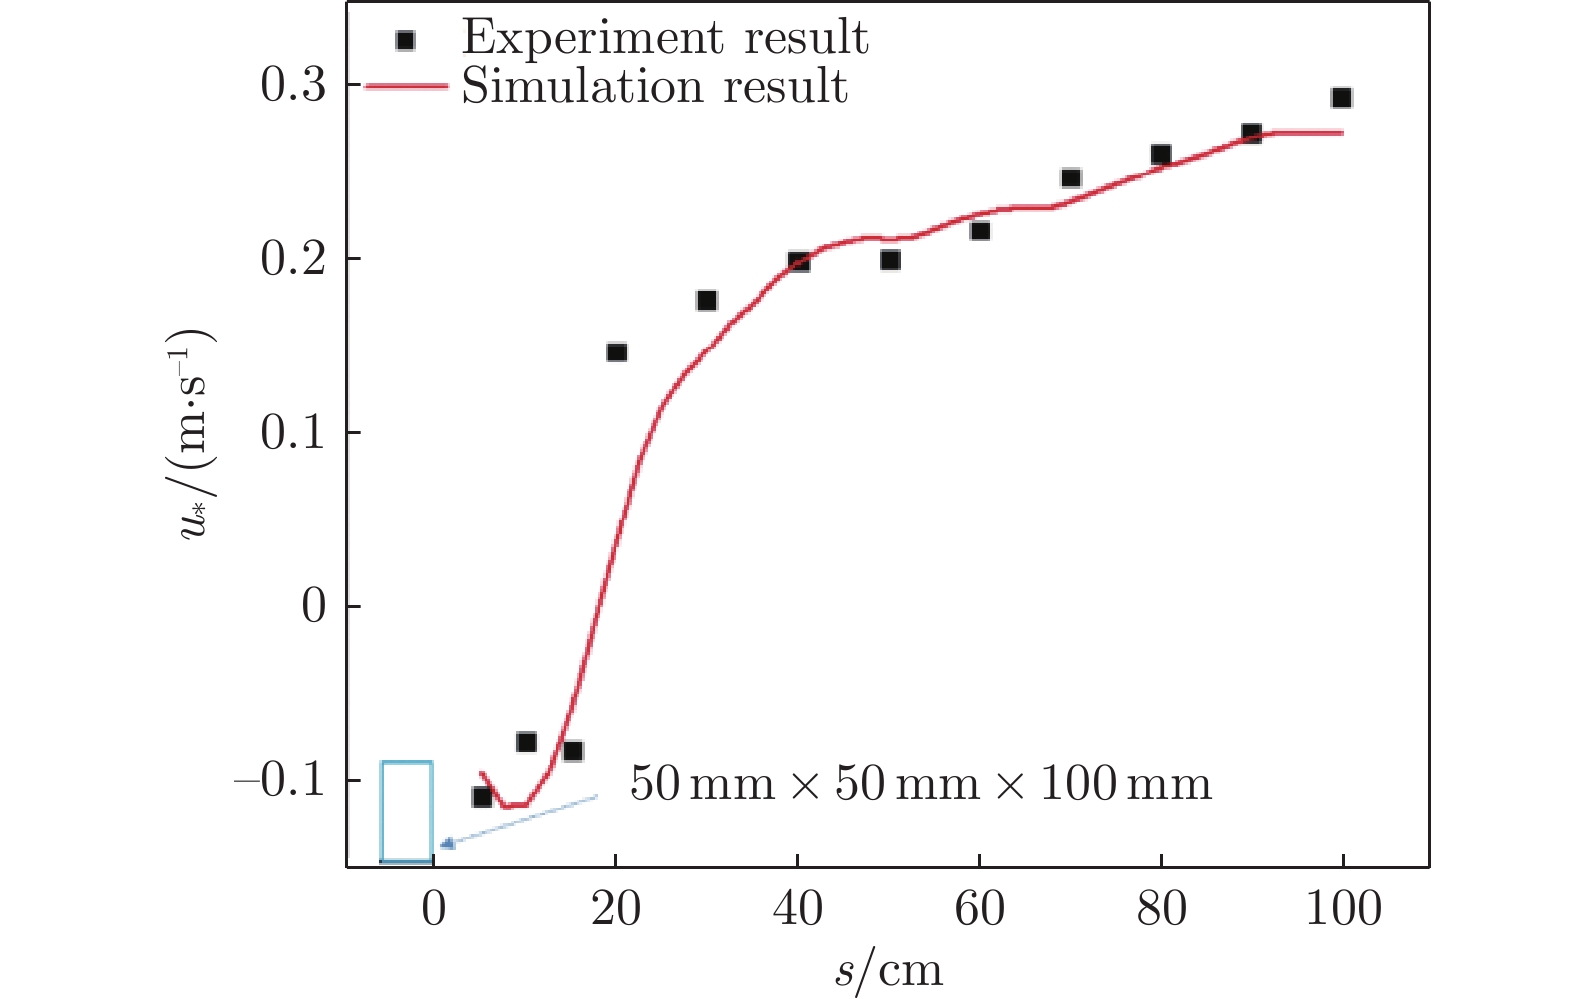
图 8 数值模拟中的地表剪切力分布Fig. 8 Spatial distribution of wall shear stress in numerical simulation从图9可以看到,通过实验得到的方柱后方不同距离(s)处的摩阻风速和数值模拟结果之间能够较好地匹配,这从另一个角度证明了热膜传感器的准确性。
![]() 图 9 实验得到的方柱绕流摩阻风速与数值模拟结果对比Fig. 9 Comparison between wind tunnel experiment and numerical simulation results of the friction velocity of flow behind a square column
图 9 实验得到的方柱绕流摩阻风速与数值模拟结果对比Fig. 9 Comparison between wind tunnel experiment and numerical simulation results of the friction velocity of flow behind a square column4 热膜地表剪切力测试仪在风洞实验中的应用
前文介绍了热膜地表剪切力测试仪的工作原理,对其准确性和抗干扰能力进行了分析,证明了其在风沙流环境下测量地表剪切力脉动值的可行性。本节采用热膜地表剪切力测试仪,在风洞实验中对风沙流不同发展阶段的地表剪切力进行测量。
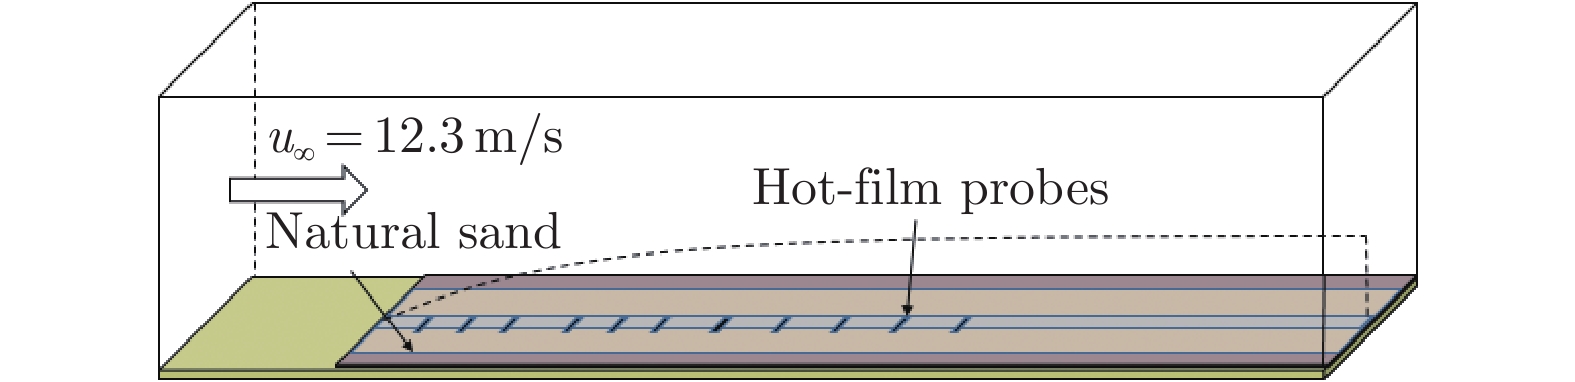
图10为风洞实验示意图。风洞实验段长度为22 m,工作截面尺寸为1.30 m × 1.45 m。在风洞中,沿流向铺设了宽0.5 m、厚0.08 m的沙床,沿风洞轴线布置了宽为3 cm的金属方管,方管上表面与沙面平齐。在方管上表面沿流向粘贴11个热膜传感器,对风沙流中的流体剪切力τa进行测量(在风沙流中,地表剪切力τ分为沙粒剪切力τp和流体剪切力τa,此处测量的地表剪切力为流体剪切力τa)。实验风速设定为12.3 m/s。
![]() 图 10 风沙流环境地表剪切力测量风洞实验示意图Fig. 10 Schematic of measurement of wall shear stress in wind-blown environment
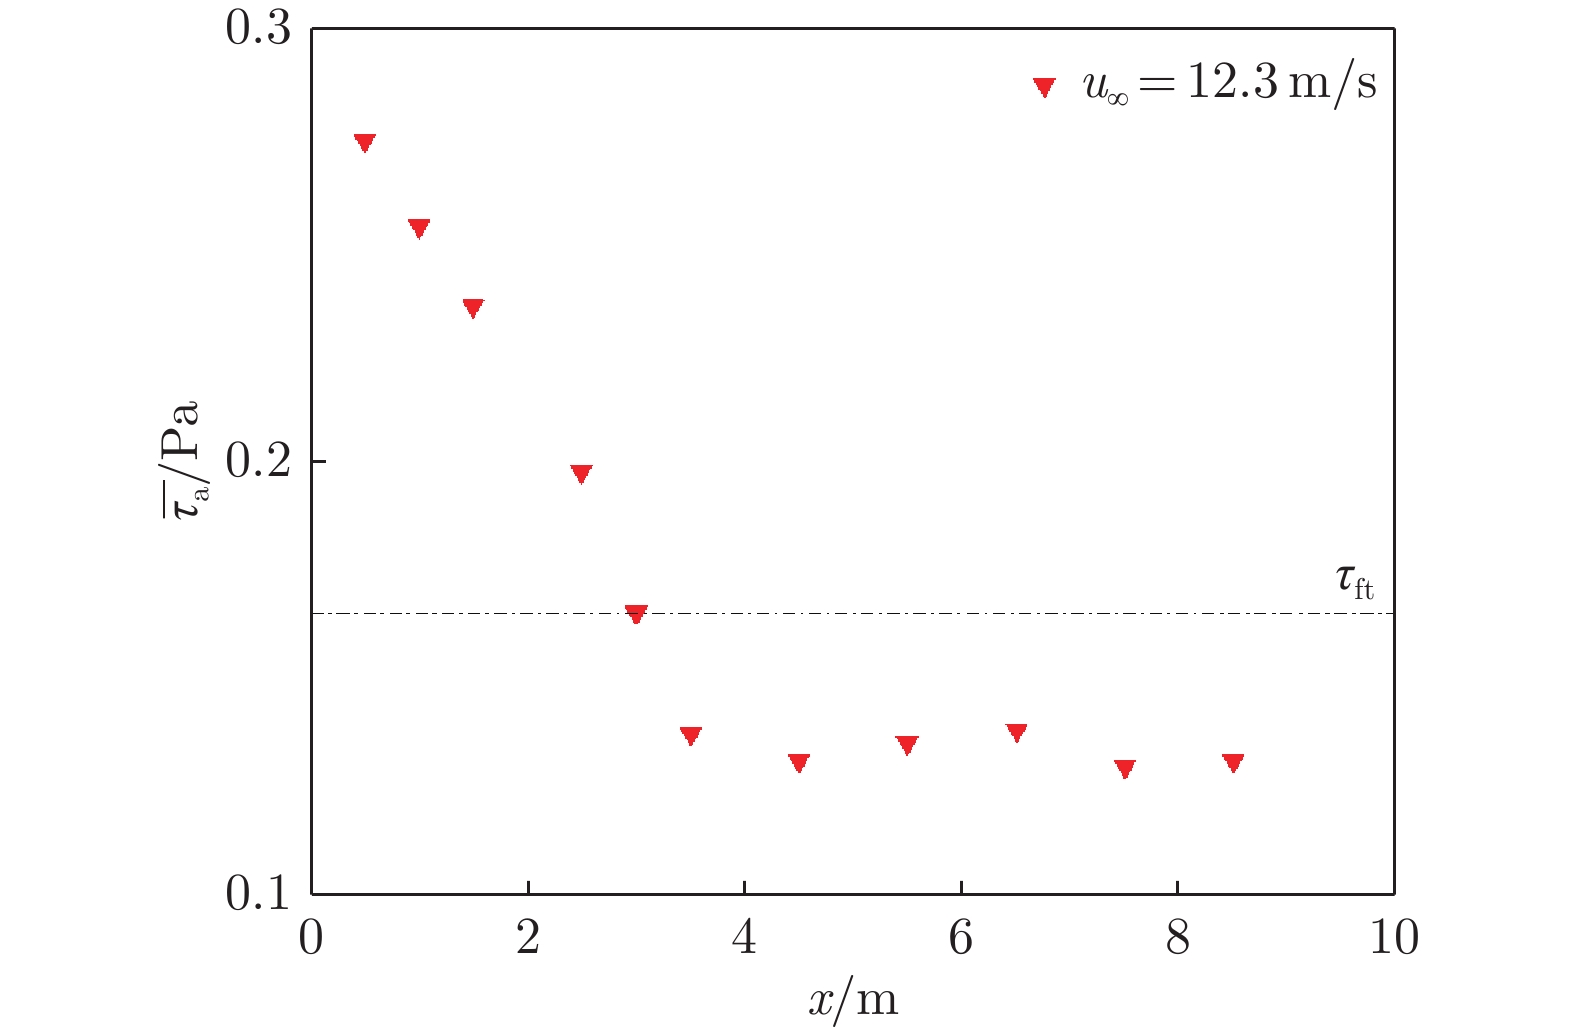
图 10 风沙流环境地表剪切力测量风洞实验示意图Fig. 10 Schematic of measurement of wall shear stress in wind-blown environment图11给出了风沙流发展过程中不同流向位置的地表剪切力,其中τft表示使沙粒离开沙床(地表)进入空中所需的地表剪切力流体起动临界值,该值可由式${\tau _{{\rm{ft}}}} = {\rho _{\rm{a}}}u_{*{\rm{ft}}}^2$得出,其中u*ft由下式确定[26]:
![]() 图 11 地表剪切力随流向位置的变化Fig. 11 Variation of wall shear stress with flow direction position
图 11 地表剪切力随流向位置的变化Fig. 11 Variation of wall shear stress with flow direction position$$ {u_{*{\rm{ft}}}} = {A_{\rm{N}}}\sqrt {\frac{{{\rho _{\rm{p}}} - {\rho _{\rm{a}}}}}{{{\rho _{\rm{a}}}}}g{d_{\rm{p}}} + \frac{\gamma }{{{\rho _{\rm{a}}}{d_{\rm{p}}}}}} $$ (17) 式中:实验参数AN = 0.111;修正参数[26]γ = 2.9 × 10⁻⁴ N/m;ρa为空气密度,dp、ρp分别为沙粒粒径和密度。
从图11可以看出:在沙床的起始位置(x < 3 m;沙床前缘起始处为x = 0 m),地表剪切力的平均值高于地表剪切力流体起动临界值τft,沙粒起动以流体起动为主;随着风沙流的发展,进入空中和落回沙床的沙粒越来越多,沙粒落地冲击地表,沙粒起动变为以冲击起动为主,此时地表剪切力平均值小于地表剪切力流体起动临界值,这与目前风沙物理学中的普遍认知相同。通过上述实验,证明热膜传感器可以对风沙流环境下的地表剪切力进行测量。
5 结 论
本文介绍了热膜传感器的工作原理,推导了标定公式,对其测量风沙流环境地表剪切力的可行性进行了验证,提出了在风洞实验中采用热膜地表剪切力测试仪测量风沙流环境地表剪切力脉动值的技术。通过风洞实验和数值模拟,验证了热膜地表剪切力测试仪的准确性,对沙粒撞击引入测量的噪声信号进行了评估。实验结果显示,热膜传感器与二维热线探头测量的摩阻风速相差不超过6.6%,风沙流中沙粒撞击产生的噪声信号比实际测量输出信号低一个数量级,数值模拟结果与热膜传感器测量结果具有较好的一致性。在风洞实验中实现了风沙流环境地表剪切力的实际测量,得出了风沙流环境下地表剪切力沿流向的空间分布规律。以上结果表明,热膜地表剪切力测试仪是一种可靠的、可用于风沙运动研究的地表剪切力测量仪器。
-
![]()
图 3 不同风速下热膜传感器的标定结果
Fig. 3 Calibration results of hot-film probes at different velociies
![]()
图 5 沙粒撞击对热膜传感器测量结果的影响
Fig. 5 Effect of particle impact on measurement results of hot-film probe
![]()
图 8 数值模拟中的地表剪切力分布
Fig. 8 Spatial distribution of wall shear stress in numerical simulation
![]()
图 9 实验得到的方柱绕流摩阻风速与数值模拟结果对比
Fig. 9 Comparison between wind tunnel experiment and numerical simulation results of the friction velocity of flow behind a square column
![]()
图 10 风沙流环境地表剪切力测量风洞实验示意图
Fig. 10 Schematic of measurement of wall shear stress in wind-blown environment
-
[1] DUPONT S, BERGAMETTI G, MARTICORENA B, et al. Modeling saltation intermittency[J]. Journal of Geophysical Research: Atmospheres, 2013, 118(13): 7109–7128. doi: 10.1002/jgrd.50528
[2] BAGNOLD R A. The physics of blown sand and desert dunes[M]. New York: W. Morrow & company, 1941.
[3] AGOSTINI L, LESCHZINER M. The connection between the spectrum of turbulent scales and the skin-friction statistics in channel flow at Reτ ≈ 1000[J]. Journal of Fluid Mechanics, 2019, 871: 22–51. doi: 10.1017/jfm.2019.297
[4] DUAN Y C, ZHONG Q, WANG G Q, et al. Contributions of different scales of turbulent motions to the mean wall-shear stress in open channel flows at low-to-moderate Reynolds numbers[J]. Journal of Fluid Mechanics, 2021, 918: A40. doi: 10.1017/jfm.2021.236
[5] JACOB C, ANDERSON W. Conditionally averaged large-scale motions in the neutral atmospheric boundary layer: insights for aeolian processes[J]. Boundary-Layer Meteo-rology, 2017, 162(1): 21–41. doi: 10.1007/s10546-016-0183-4
[6] RICHTER D H, SULLIVAN P P. Modification of near-wall coherent structures by inertial particles[J]. Physics of Fluids, 2014, 26(10): 103304. doi: 10.1063/1.4900583
[7] RANA S, ANDERSON W, DAY M. Turbulence-based model for subthreshold aeolian saltation[J]. Geophysical Research Letters, 2020, 47(15): e2020GL088050. doi: 10.1029/2020GL088050
[8] LI G, ZHANG J, HERRMANN H J, et al. Study of aerodynamic grain entrainment in aeolian transport[J]. Geophysical Research Letters, 2020, 47(11): e2019GL086574. doi: 10.1029/2019GL086574
[9] COMOLA F, KOK J F, CHAMECKI M, et al. The intermittency of wind-driven sand transport[J]. Geophysical Research Letters, 2019, 46(22): 13430–13440. doi: 10.1029/2019GL085739
[10] YIN X, JIANG C, SHAO Y P, et al. Large-eddy-simulation study on turbulent particle deposition and its dependence on atmospheric-boundary-layer stability[J]. Atmospheric Che-mistry and Physics, 2022, 22(7): 4509–4522. doi: 10.5194/acp-22-4509-2022
[11] TAN L H, AN Z S, ZHANG K, et al. Intermittent aeolian saltation over a Gobi surface: threshold, saltation layer height, and high-frequency variability[J]. Journal of Geophysical Research: Earth Surface, 2020, 125(1): e2019JF005329. doi: 10.1029/2019JF005329
[12] ZHENG X J, JIN T, WANG P. The influence of surface stress fluctuation on saltation sand transport around threshold[J]. Journal of Geophysical Research: Earth Surface, 2020, 125(5): e2019JF005246. doi: 10.1029/2019JF005246
[13] KAWAMURA R. Study on sand movement by wind[J]. Annual Report Institute Science and Technology, 1951, 5(3): 95–112.
[14] LETTAU K. Experimental and micro-meteorological field studies of dune migration[M]. LETTAU H H, LETTAU K, Exploring in the World's driest climate. Madison: University of Wisconsin-Madison, 1978: 110-147.
[15] SØRENSEN M. On the rate of aeolian sand transport[J]. Geomorphology, 2004, 59(1-4): 53–62. doi: 10.1016/j.geomorph.2003.09.005
[16] SLINN W G N. Predictions for particle deposition to vegetative canopies[J]. Atmospheric Environment (1967), 1982, 16(7): 1785–1794. doi: 10.1016/0004-6981(82)90271-2
[17] ZHANG J, SHAO Y. A new parameterization of particle dry deposition over rough surfaces[J]. Atmospheric Chemistry and Physics, 2014, 14(22): 12429–12440. doi: 10.5194/acp-14-12429-2014
[18] PRESTON J H. The determination of turbulent skin friction by means of pitot tubes[J]. The Journal of the Royal Aeronautical Society, 1954, 58(518): 109–121. doi: 10.1017/s0368393100097704
[19] IRWIN H P A H. A simple omnidirectional sensor for wind-tunnel studies of pedestrian-level winds[J]. Journal of Wind Engineering and Industrial Aerodynamics, 1981, 7(3): 219–239. doi: 10.1016/0167-6105(81)90051-9
[20] FAGE A, FALKNER V M. On the relation between heat transfer and surface friction for laminar flow[R]. Aeronautical Research Communications Report Memoran-dum, Report No. 1408, 1931.
[21] LUDWIEG H. Instrument for measuring the wall shearing stress of turbulent boundary layers[R]. NACA Technical Memorandum 1284, 1950.
[22] LIEPMANN H W, SKINNER G T. Shearing-stress measurements by use of a heated element[R]. NACA Technical Note 3268, 1954.
[23] BELLHOUSE B J, SCHULTZ D L. The measurement of fluctuating skin friction in air with heated thin-film gauges[J]. Journal of Fluid Mechanics, 1968, 32(4): 675–680. doi: 10.1017/s0022112068000959
[24] SUN B Y, WANG P B, LUO J, et al. A flexible hot-film sensor array for underwater shear stress and transition measurement[J]. Sensors, 2018, 18(10): 3469. doi: 10.3390/s18103469
[25] WALTER B, GROMKE C, LEONARD K, et al. Spatially resolved skin friction velocity measurements using Irwin sensors: A calibration and accuracy analysis[J]. Journal of Wind Engineering and Industrial Aerodynamics, 2012, 104-106: 314–321. doi: 10.1016/j.jweia.2012.02.018
[26] SHAO Y P, LU H. A simple expression for wind erosion threshold friction velocity[J]. Journal of Geophysical Research: Atmospheres, 2000, 105(D17): 22437–22443. doi: 10.1029/2000JD900304
-
期刊类型引用(0)
其他类型引用(1)
 下载:
下载:


计量
- 文章访问数: 178
- HTML全文浏览量: 103
- PDF下载量: 70
- 被引次数: 1