Study on the flow of water sand slurry with sliding bed in inclined pipe
-
摘要: 为进一步研究伴有滑动床的倾斜浆体管道砂颗粒输送规律,应用力平衡理论,研究了悬浮层、滑动床层速度以及滑动床厚度求解方法,由此给出了倾斜管道淤积临界速度迭代求解方法。同时,应用悬浮层剪应力线性分布假设,并借助普朗特经验公式,给出了滑动床上方速度分布模型。粗砂管道水力输送实验数据表明:(1)淤积临界流速与颗粒粒径和输送浓度负相关,输送浓度不变时,淤积临界流速与管道倾角大小正相关。与模型计算结果对比表明淤积临界速度计算值和实测值最大偏差为13%;(2)随着管道倾角增加,最大速度点位置有向上偏移的趋势。与计算结果对比表明上层速度分布理论模型计算值和实测值偏差不超过10%。结果表明力平衡理论和剪应力线性分布假设能够较好地用于伴有滑动床的倾斜粗砂浆体管道淤积临界速度和滑动床上方速度分布预测研究。Abstract: In order to further study sand particles' transport rules in the inclined slurry pipe associated with the sliding bed, force balance theories are used to study the method for evaluating the suspended layer and sliding bed velocities as well as the sliding bed thickness, and an iterative method for computing the deposit critical velocity is given. Meanwhile, the shear force linear distribution assumption is used and with the aid of prandt empirical formula, a velocity distribution model above the sliding bed is given. Experimental data of coarse sand pipe hydraulic transportation show that the deposit critical velocity is negatively correlated with the particle size and concentration, and it is positively correlated with the pipe dip angle when the transportation concentration is kept constant. The comparison between the calculated results and the measured results show that the maximum deviation of the calculated value from the measured value is 13%. The experimental data also shows that with the increase of the angle of the pipe, the maximum velocity point position has an upward trend. The comparison between the calculated and measured results shows that the deviation of the theoretical velocity distribution model and the measured value is not more than 10%. Results show that the force balance theory and the linear hypothesis of the shear stress distribution apply well in the research of deposition critical velocity and velocity distribution above sliding bed in the inclined coarse sand slurry pipe accompanied with the sliding bed.
-
0 引言
目前,要求地面试验设备完全模拟高超声速飞行环境是非常困难的,在一个试验设备上进行所有环境的模拟试验更是不可能的。因此,需要研制多种试验设备,以满足高超声速试验需求[1-5]。
常规高超声速风洞主要模拟参数是马赫数和雷诺数[6],其他一些参数则主要通过高焓试验设备来模拟[7-8]。
在高超声速风洞运行中,气源不仅要维持风洞所必须达到的压力比,还需要满足雷诺数模拟的要求。一般来说,风洞的总压要足够高。如果风洞连续工作,高的压力比和高总压将使风洞消耗很大的动力,因而高超声速风洞多为暂冲式。
暂冲式常规高超声速风洞的运行方式是:气罐中的压缩空气经过加热系统达到所需温度,然后通过型面喷管,在试验段形成所需的高超声速流场,最后经由超声速扩散段升压后进入引射排气系统,排入大气,或经过冷却器进入真空系统,由真空泵系统排入大气。常规高超声速风洞一般加热温度在800K以下,主要是为了防止气流冷凝,不能真实模拟实际总温(马赫数6时达到1800K),因此,开展发动机及飞行器一体化带动力试验还需要满足总温要求的高焓设备。
燃烧加热风洞是目前高超声速飞行器地面模拟试验尤其是带动力试验的主要设备。在过去的十几年间,中国空气动力研究与发展中心研制了不同尺度的脉冲燃烧风洞,探索了一体化飞行器设计、计算与试验技术[7-9]。在此基础上,发展了基于脉冲燃烧风洞的大尺度飞行器带动力一体化试验技术[10-11],提出了一种基于一体化试验直接测力结果的飞行器和发动机性能评估方法。
由于采用燃烧加热方式,无论是采用氢燃料还是碳氢燃料,都会产生水蒸气(H2O)、二氧化碳(CO2)等燃烧产物,即形成所谓“污染”。污染组分将造成风洞试验气体物理化学属性与真实空气存在一定差异,导致地面试验难以完全模拟真实飞行状态下的所有来流参数,且给地面试验结果向真实飞行状态的外推带来不确定性。为了尽可能降低这种不确定性,地面试验一般需要慎重考虑试验来流与模拟对象环境之间的参数匹配问题:即通过有选择地调整污染来流的某些状态参数,使之逼近对应的真实飞行环境,同时放弃一些无法兼顾的非关键参数,以尽可能达到飞行器气动与推进性能的可靠模拟。
目前主要有两种模拟方式:对于气动力试验,一般采用静温、静压、马赫数模拟;对于发动机性能试验,也可以采用总焓、动压、马赫数模拟。
中国科技大学杨基明、罗喜胜等[12-13]通过典型升力体飞行器的试验和计算研究,证明污染组分使得斜激波波后参数相对纯净空气有一定变化,从而造成模型表面压力及模型的气动力有一定变化,但变化量较小。相对于纯净空气来流,污染空气来流时发动机推力、单位推力、比冲均有所下降。脉冲燃烧风洞采用氢氧燃烧加热,污染空气来流时推力性能下降相对较小,与纯净空气来流时较为接近。
西北工业大学宋文艳等[14]研究了H2O/CO2污染煤油燃料对超声速燃烧室的影响,认为污染对点火和超声速燃烧具有一定的抑制作用,污染组分的存在会导致燃烧室模态转换点发生变化。
谭宇等[15]在酒精燃烧和氢气燃烧两种加热方式的风洞设备上开展了匹配方案对超燃冲压发动机性能影响的试验研究,比较了两种目前较常用的气流参数匹配方案,结果表明:对于采用氢气燃烧加热方式的风洞设备,总焓动压马赫数(h0QM)匹配比静温静压马赫数(TPM)匹配能够获得更高的壁面静压和推力收益;对于采用酒精燃烧加热方式的风洞设备,两种匹配方案表现相当。
壁温比通常定义为模型壁面温度与恢复温度的比值。常规高超声速风洞来流温度较低,气流壁面恢复温度与壁面温度相差不大,接近于绝热状态;而燃烧加热脉冲风洞来流温度较高,风洞试验时间很短(300~600ms),壁面温度基本保持常温,接近于等温状态,气流壁面恢复温度与试验模型表面温差较大,气流对壁面的加热效应明显。壁面温度条件会影响到高超声速边界层内的流动参数,进而影响到流场的波系结构和气动性能。壁温降低引起摩擦系数的增加和边界层厚度减小,使得激波边界层作用区域变小;同时,冷壁使得边界层内亚声速部分声速较低,马赫数更高。
为了评估真实飞行条件下的飞行器气动性能,需重点考虑壁温对燃烧加热脉冲风洞试验结果的影响。
本文采用不通气标模,在常规高超声速风洞以及两个不同尺度(Φ2.4m和Φ600mm)的脉冲燃烧风洞中开展对比测力试验,结合数值计算,研究脉冲燃烧风洞水凝结、雷诺数及壁温比对模型气动性能的影响规律。
1 试验模型
试验模型采用不通气标模。对应Φ2.4m脉冲燃烧风洞,试验模型为大不通气标模,采用背部支撑,如图 1所示;对应常规高超声速风洞和Φ600mm脉冲燃烧风洞,试验模型为1/5缩比的小不通气标模,采用尾部支撑,如图 2所示。
2 脉冲燃烧风洞水凝结影响研究
为了获得水凝结对脉冲燃烧风洞试验数据的影响,采用小不通气标模,在Φ600mm脉冲燃烧风洞开展不同总温条件下的对比试验研究,分析测力结果。
2.1 对比试验参数
对Φ600mm脉冲燃烧风洞喷管进行了试验配套改造,在来流总温、组分不同的条件下,保持风洞出口马赫数一致。以现有的Ma6喷管为基础(总温1500K),设计制造总温为1200和1800K的喉道段,喷管出口马赫数与现有喷管一致。表 1为不通气高超标模试验参数(p0、T0分别为总压、总温,p、T分别为静压、静温)。
表 1 不同总温高超标模试验参数Table 1 Flow parameters of different T0 testsMa p0/MPa T0/K p/Pa T/K Re 6.0 4.5 1200 2368 162 7.08×10⁶ 6.0 5.1 1500 2398 210 4.98×10⁶ 6.0 5.8 1800 2374 263 3.61×10⁶ 2.2 试验结果
图 3、4给出了不通气高超标模的轴向力系数CA、法向力系数CN随迎角α变化的试验结果曲线。
![]() 图 3 高超标模不同总温试验CA~α曲线Fig. 3 CA~α graph of different T0 tests for the typical hypersonic model
图 3 高超标模不同总温试验CA~α曲线Fig. 3 CA~α graph of different T0 tests for the typical hypersonic model![]() 图 4 高超标模不同总温试验CN~α曲线Fig. 4 CN~α graph of different T0 tests for the typical hypersonic model
图 4 高超标模不同总温试验CN~α曲线Fig. 4 CN~α graph of different T0 tests for the typical hypersonic model试验表明:在总温1200~1800K试验状态下,最大轴向力系数差别为5.4%,说明水凝结对不通气高超标模的轴向力影响很小,约为5%左右。在-2°迎角时,总温1200K(有水凝结)试验状态的法向力系数较总温1500K减小了约40%;在0°~6°迎角下,法向力系数减小12%~5%,说明随着迎角的增加,模型下表面的凝结水蒸发,导致水凝结对法向力的影响减小。在-2°迎角时,总温1800K试验状态的法向力系数较总温1500K增加了约30%,说明总温1500K、-2°迎角状态在模型的下表面也发生了水凝结,导致模型下表面流场压力升高,法向力系数减小;而在其他迎角状态,总温1500K时并没有发生水凝结现象,因此法向力系数差别较小。
3 脉冲燃烧风洞雷诺数影响研究
3.1 对比试验参数
为了获得雷诺数对试验结果的影响,用不同尺度的不通气标模在Φ2.4m脉冲燃烧风洞和Φ600mm脉冲燃烧风洞进行对比试验,试验参数见表 2(CHIF:脉冲燃烧风洞)。
表 2 试验参数Table 2 Test parametersFacility Ma T0/K p0/MPa Φ2.4m CHIF 6 1575 4.76 Φ600mm CHIF 6 1500 4.61 3.2 试验和计算结果
图 5和6给出了大、小不通气标模在两个脉冲燃烧风洞的轴向力系数CA、法向力系数CN试验结果,同时也给出了两个模型按照对应风洞来流条件计算获得的气动力系数结果。
![]() 图 5 不通气标模轴向力系数计算和试验结果Fig. 5 Numerical and experimental axis force coefficients of the test model
图 5 不通气标模轴向力系数计算和试验结果Fig. 5 Numerical and experimental axis force coefficients of the test model![]() 图 6 不通气标模法向力系数计算和试验结果Fig. 6 Numerical and experimental normal force coefficients of the test model
图 6 不通气标模法向力系数计算和试验结果Fig. 6 Numerical and experimental normal force coefficients of the test model计算结果表明:模型尺度对不通气标模的轴向力有一定影响,小不通气标模的轴向力略大于大不通气标模,相差约2%~5%。由于两个脉冲燃烧风洞模拟条件基本相同,试验时间也接近,因此这个差异可以解释为模型尺度(雷诺数)造成的:小不通气标模的雷诺数小于大不通气标模,因此轴向力略大。试验并未能够反映出雷诺数的影响,这可能是由于两个模型支撑方式不同以及试验测量误差掩盖了差异。
两个模型的法向力结果不一致,主要是由于支撑方式不同造成的。前期研究表明,腹部支撑对轴向力影响不大,但对法向力影响显著。
计算与试验结果符合较好,使计算和试验得到了相互验证。
4 脉冲燃烧风洞壁温比影响研究
采用小不通气标模,通过Φ600mm脉冲燃烧风洞及常规高超声速风洞的试验对比,结合数值计算,研究壁温比对脉冲燃烧风洞试验结果的影响。
4.1 对比试验参数
Φ600mm脉冲燃烧风洞与Φ1m常规高超声速风洞的试验流场存在总温、雷诺数、壁温比等方面的差异。假设壁温300K,风洞流场参数对比如表 3所示(HWT:常规高超声速风洞;Tratio为壁温比)。
表 3 Φ1m常规高超声速风洞与Φ600mm脉冲燃烧风洞流场参数Table 3 Test parameters of Φ1m hypersonic wind tunnel and Φ600mm combustion heated impulse facilityFacility Ma p0/MPa T0/K γ Re Tratio Φ1m HWT 6.0 3.00 500 1.40 2.62×10⁷ 5.17 Φ600mm CHIF 6.0 4.65 1560 1.36 4.10×10⁶ 1.49 4.2 试验和计算结果
脉冲燃烧风洞试验与计算结果表明:采用等温壁300K条件计算获得的阻力系数与试验数据比较接近,误差在6%以内;绝热壁计算阻力系数较等温壁300K计算小5%(迎角6°)~15%(迎角-2°);不同壁温条件对升力系数的计算结果影响不大,与试验结果的误差分别在6%和8%以内;采用等温壁300K条件计算获得的结果与试验基本一致。图 7和8给出了脉冲燃烧风洞试验和计算的阻力系数CD及升力系数CL的对比曲线。
![]() 图 7 CD~α试验与计算结果对比(脉冲风洞,总温1500K)Fig. 7 CD~α comparison of numerical and experimental results from Φ600mm combustion heated impulse facility
图 7 CD~α试验与计算结果对比(脉冲风洞,总温1500K)Fig. 7 CD~α comparison of numerical and experimental results from Φ600mm combustion heated impulse facility![]() 图 8 CL~α试验与计算结果对比(脉冲风洞,总温1500K)Fig. 8 CL~α comparison of numerical and experimental results from Φ600mm combustion heated impulse facility
图 8 CL~α试验与计算结果对比(脉冲风洞,总温1500K)Fig. 8 CL~α comparison of numerical and experimental results from Φ600mm combustion heated impulse facility常规高超声速风洞试验和计算结果表明:不同壁温条件对计算结果影响不大,计算结果与试验符合较好,阻力误差在4%以内,升力误差在3%以内。图 9和10给出了相应的阻力系数和升力系数比较曲线。
![]() 图 9 CD~α试验与计算结果对比(常规高超声速风洞)Fig. 9 CD~α comparison of numerical and experimental results from Φ1m hypersonic wind tunnel
图 9 CD~α试验与计算结果对比(常规高超声速风洞)Fig. 9 CD~α comparison of numerical and experimental results from Φ1m hypersonic wind tunnel![]() 图 10 CL~α试验与计算结果对比(常规高超声速风洞)Fig. 10 CL~α comparison of numerical and experimental results from Φ1m hypersonic wind tunnel
图 10 CL~α试验与计算结果对比(常规高超声速风洞)Fig. 10 CL~α comparison of numerical and experimental results from Φ1m hypersonic wind tunnel通过试验验证,表明数值计算具有较高的可信度。为了进一步分析规律,采用数值计算分析了脉冲燃烧风洞与常规高超声速风洞阻力系数的数据相关性,如图 11所示。
![]() 图 11 CD~α计算与试验结果对比(脉冲燃烧风洞和常规高超声速风洞)Fig. 11 CD~α comparison of numerical and experimental results from combustion heated impulse facility and hypersonic wind tunnel
图 11 CD~α计算与试验结果对比(脉冲燃烧风洞和常规高超声速风洞)Fig. 11 CD~α comparison of numerical and experimental results from combustion heated impulse facility and hypersonic wind tunnel(1) 脉冲燃烧风洞等温壁计算得到的阻力系数比常规高超声速风洞大7%(迎角6°)~17%(迎角-2°),迎角越小,差异越大。这个差异由多方面因素导致,主要有雷诺数、比热比、壁温比等。
(2) 针对同一个模型,分别采用脉冲燃烧风洞和常规高超声速风洞的模拟参数计算(壁面都取绝热壁条件),此时得到的结果差异应该排除了壁温比的影响,而反映了两个风洞模拟条件(如雷诺数、比热比)不同引起的变化量,计算获得的这一部分的影响量约为3%(迎角6°)~6%(迎角-2°)。
(3) 除去两个风洞模拟条件(如雷诺数、比热比)不同引起的阻力变化量,可得到壁温比的影响量约为4%(迎角6°)~12%(迎角-2°),迎角越小,差异越大。
5 结论
通过脉冲燃烧风洞与常规高超声速风洞不通气高超标模对比试验和计算,得到如下结论:
(1) 脉冲燃烧风洞获得的气动力系数变化规律与常规高超声速风洞一致;
(2) 雷诺数、壁温比对阻力系数均有影响,其中壁温比影响显著,脉冲燃烧风洞获得的阻力系数明显大于常规高超声速风洞;
(3) 水凝结对不通气高超标模的轴向力影响较小,对法向力影响较大,且不同迎角状态影响量不同。
-
![]()
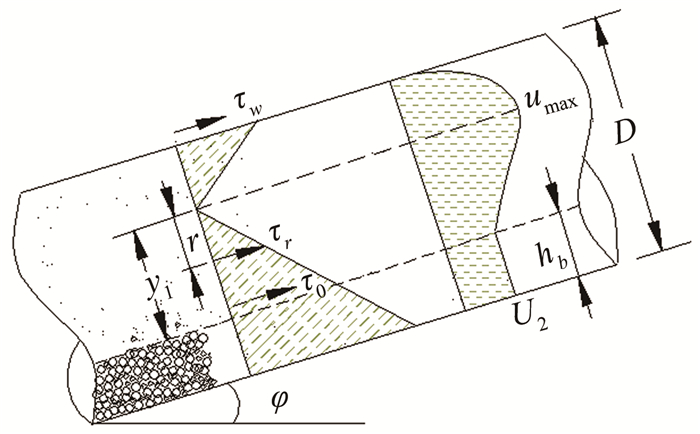
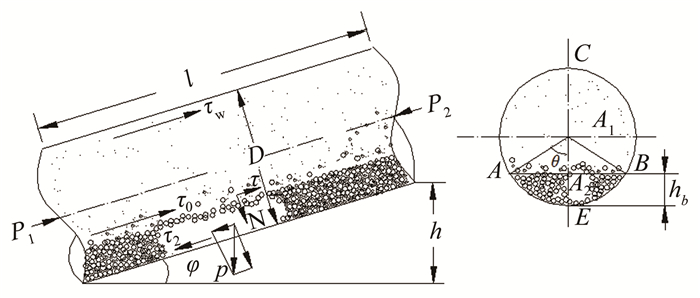
图 3 伴有滑动床的倾斜管道速度分布和剪应力分布示意图
Fig. 3 Schematic diagram of velocity distribution and shear stress distribution of inclined slurry pipe with sliding bed
![]()
图 4 试验管路布置及等动力测量装置布置图
1浆体泵; 2浆体罐子; 3泄流阀; 4流量取样; 5热交换器; 6缩颈阀; 7电机; 8滑轮; 9亚克力透明管; 10测试管段; 11旁路浆体泵; 12探头; 13, 14压差计; 15, 16阀门; 17排泄阀; 18流量计
Fig. 4 Layout of test pipeline and isokinetic measuring pipe
![]()
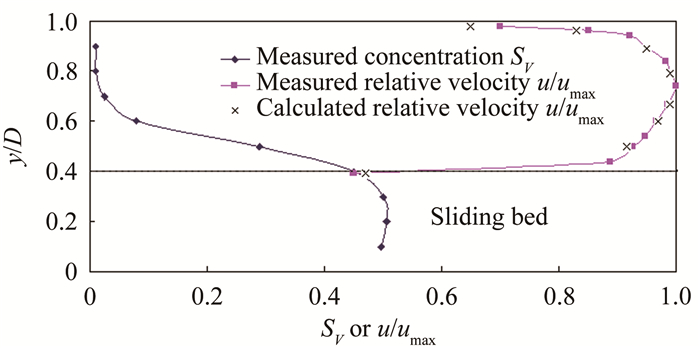
图 7 水平管道速度分布计算值和实测值对比
Fig. 7 Comparison of calculated and measured values of velocity distribution in horizontal pipe
![]()
图 8 倾斜管道速度分布计算值和实测值对比
Fig. 8 Comparison of calculated and measured values of velocity distribution in inclined pipe
![]()
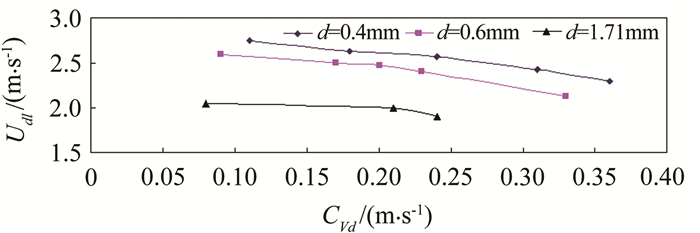
图 9 淤积临界流速与颗粒粒径和输送浓度的关系
Fig. 9 Relationship between critical deposit velocity and particle transport concentration
![]()
图 10 淤积临界流速和管道倾角关系
Fig. 10 The relationship between the critical deposit velocity and the inclination of the pipeline
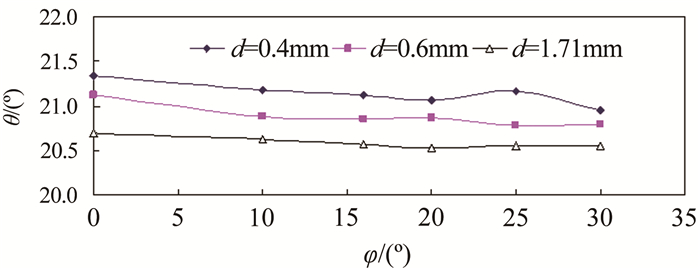
![]()
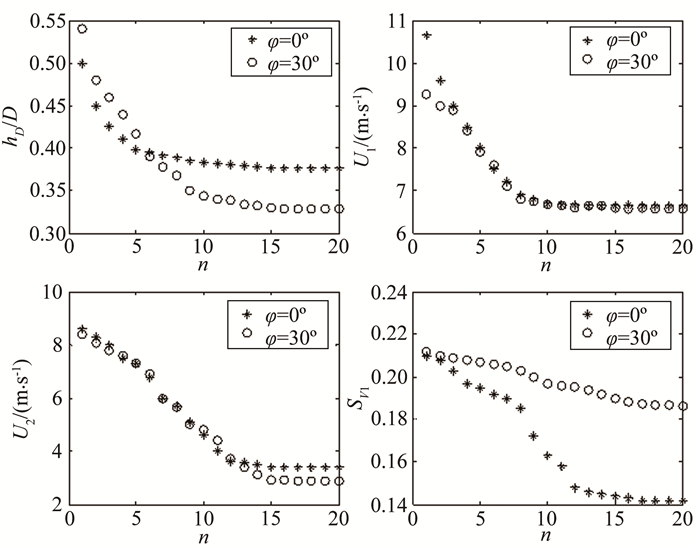
图 11 管道倾角φ变化对滑动床角度θ的影响
Fig. 11 The influence of the change of the pipe angle φ on angle of the sliding bed θ
![]()
图 12 淤积临界流速Udl计算值和实测值对比
Fig. 12 Comparison of calculated value and measured value of critical deposit velocityUdl
表 1 水平管道流动实验工况
Table 1 Experimental conditions for horizontal pipe flow
第1组 第2组 第3组 d=0.4mm d=0.6mm d=1.71mm CVd=0.11~0.36 CVd=0.09~0.33 CVd=0.08~0.24  下载: 导出CSV
表 2 倾斜管道流动实验工况
Table 2 Experimental conditions for inclined pipe flow
第1组 第2组 第3组 d=0.4mm d=0.6mm d=1.71mm CVd=0.20~0.22 CVd=0.20~0.22 CVd=0.20~0.22 φ=10°~30° φ=10°~30° φ=10°~30°
下载: 导出CSV
-
[1] 张士林.浆体管道淤积流速数值计算方法研究[J].水力采煤与管道运输, 2011, (4):6-9. http://www.cnki.com.cn/Article/CJFDTOTAL-SLCM201104004.htm Zhang S L. Research on numerical calculation method of slurry pipeline deposition velocity[J]. Hydraulic Coal Mining & Pipeline Transportation, 2011, (4):6-9. http://www.cnki.com.cn/Article/CJFDTOTAL-SLCM201104004.htm
[2] 郗夏楠, 孙西欢, 李永业, 等.管道水力输送临界流速研究进展综述[J].山西水利, 2012, (3):36-38. http://www.cnki.com.cn/Article/CJFDTOTAL-SXLS201203023.htm Xi X N, Sun X H, Li Y Y, et al. Review of research progress on critical flow velocity of pipeline hydraulic transport[J]. Shanxi Water Resources, 2012, (3):36-38. http://www.cnki.com.cn/Article/CJFDTOTAL-SXLS201203023.htm
[3] 陈琴瑞, 李甲.浆体管道输送临界流速经验公式适宜性分析[J].中国矿山工程, 2015, 4(6):73-75. http://www.cnki.com.cn/Article/CJFDTOTAL-YSKS201506027.htm Chen Q R, Li J. Suitability analysis of empirical formulas for critical velocity in slurry pipeline transportation[J]. China Mine Engineering, 2015, 4(6):73-75. http://www.cnki.com.cn/Article/CJFDTOTAL-YSKS201506027.htm
[4] 王新民, 李天正, 张钦礼.基于GA-ELM浆体管道输送临界流速预测模型研究[J].中国安全生产科学技术, 2015, 11(8):101-105. http://www.cnki.com.cn/Article/CJFDTOTAL-LDBK201508019.htm Wang X M, Li T Z, Zhang Q L. Study on prediction model of critical flow velocity in slurry pipeline transportation based on GA-ELM[J]. Journal of Safety Science and Technology, 2015, 11(8):101-105. http://www.cnki.com.cn/Article/CJFDTOTAL-LDBK201508019.htm
[5] 秦德庆, 曹斌, 夏建新.不同颗粒物料管道水力输送不淤临界流速的确定[J].矿冶工程, 2014, 34(1):9-11. http://www.cnki.com.cn/Article/CJFDTOTAL-KYGC201401005.htm Qin D Q, Cao B, Xia J X. Study on non-depositing velocity of different particle materials in pipeline by hydraulic transportation[J]. Mining and Metallurgical Engineering, 2014, 34(1):9-11. http://www.cnki.com.cn/Article/CJFDTOTAL-KYGC201401005.htm
[6] 旷水泉.大石河铁尾矿高浓度管道输送临界流速研究[J].水力采煤与管道运输, 2015, (2):1-5. http://www.cnki.com.cn/Article/CJFDTOTAL-SLCM201502003.htm Kuang S Q. Study on critical flow velocity of high concentration pipeline transportation of iron tailings in Dashihe[J]. Hydraulic Coal Mining & Pipeline Transportation, 2015, (2):1-5. http://www.cnki.com.cn/Article/CJFDTOTAL-SLCM201502003.htm
[7] Souza P T C, Moraes J D, Slatter P T, et al. Modelling the critical velocity for heterogeneous flow of mineral slurries[J]. In International Journal of Multiphase Flow, 2014, 65:31-37. DOI: 10.1016/j.ijmultiphaseflow.2014.05.013
[8] Sanni E S, Olawale S A, Adefila S S. Theoretical study of sand entrainment and deposits in horizontal oil transport[J]. Science Research, 2015, 3(6):314-323. DOI: 10.11648/j.sr.20150306.18
[9] Rice H P, Fairweather M, Peakall J, et al. Constraints on the functional form of the critical deposition velocity in solid-liquid pipe flow at low solid volume fractions[J]. Chemical Engineering, 2015, (126):759-770. https://www.researchgate.net/publication/272758756_Constraints_on_the_functional_form_of_the_critical_deposition_velocity_in_solid-liquid_pipe_flow_at_low_solid_volume_fractions
[10] Boulanger J, Joan B. Sand suspension deposition in horizontal low-concentration slurry pipe flows[J]. Granular Matter, 2016, 18(2):1-10. https://www.researchgate.net/publication/297651164_Sand_suspension_deposition_in_horizontal_low-concentration_slurry_pipe_flows?_sg=zNVlcqEbfcJPw-dBF5k3l_4KQLJlS0kDVk964Hwdp3ErqmFynsyUA3hV5TtsOIQVnRoh_Zo3ChUXwhJrZXxkDUncdamtnm2nbMkVS0wbnqY
[11] Harbottle D, Fairweather M, Biggs S. The minimum transport velocity of colloidal silica suspensions[J]. Chemical Engineering Science, 2011, 66(11):2309-2316. DOI: 10.1016/j.ces.2011.02.012
[12] Rice H. Transport and deposition behaviour of model slurries in closed pipe flow[D]. Leeds:University of Leeds, 2013:112-122.
[13] Kotzé M, Sutherland A, Kotzé R. A system to estimate coarse particle velocities at the pipe wall in settling slurry flow[J]. Flow Measurement and Instrumentation, 2013, (32):63-70. https://www.researchgate.net/publication/257396499_A_system_to_estimate_coarse_particle_velocities_at_the_pipe_wall_in_settling_slurry_flow
[14] Mario R R, Eduardo S A. Two-layer model for horizontal pipe flow of newtonian and non-newtonian settling dense slurries[J]. Ind Eng Chem Res, 2012, 51(20):7095-7103. DOI: 10.1021/ie201667k
[15] Abd Al Aziz A I, Mohamed H I. A study of the factors affecting transporting solid-liquid suspension through pipelines[J]. Open Journal of Fluid Dynamics, 2013, (3):152-162. http://www.oalib.com/paper/2991295
[16] Vaclav M, Jan K. Stationary-and sliding beds in pipe flows of settling slurry[C]//The Proceedings of the 15th International Freight Pipeline Society Symposium. Prague:Taylor & Francis, 2014:231-237.
[17] Matouseka V, Krupickaa J, Penika V. Distribution of medium-to-coarse glass beads in slurry pipe flow:evaluation of measured concentration profiles[J]. Particulate Science and Technology, 2014, 32(2):186-196. DOI: 10.1080/02726351.2013.840706
[18] Matouseka V, Krupickaa J, Penika V. Distribution of medium-to-coarse glass beads in slurry pipe flow:evaluation of measured concentration profiles[J]. Particulate Science and Technology, 2014, 32(2):186-196. DOI: 10.1080/02726351.2013.840706
[19] Sape A M. An overview of theories describing head losses in slurry transport:a tribute to some of the early researchers[J]. Pipeline and Riser Technology, 2013, 4(03):233-241. https://www.researchgate.net/profile/Sape_Miedema/publication/271445841_AN_OVERVIEW_OF_THEORIES_DESCRIBING_HEAD_LOSSES_IN_SLURRY_TRANSPORT_A_TRIBUTE_TO_SOME_OF_THE_EARLY_RESEARCHERS/links/54ca5a2e0cf2c70ce521cb72.pdf?origin=publication_list
[20] 赵利安.大颗粒浆体管内流动规律研究[D].阜新:辽宁工程技术大学, 2011:98-109. Zhao Li-an. Study on flow law of large particle slurry in pipeline[D]. Fuxin:Liaoning Technical University, 2011:98-109.
[21] 林雪松, 陈殿强, 何峰, 等.固液两相流中颗粒浓度分布统一公式的研究[J].水资源与水工程学报, 2013, 24(4):82-84. http://www.cnki.com.cn/Article/CJFDTOTAL-XBSZ201304021.htm Lin X S, Chen D Q, He F, et al. Study on unified formula of particle concentration distribution in two-phase flow of liquid-solid[J]. Journal of Water Resources & Water Engineering, 2013, 24(4):82-84. http://www.cnki.com.cn/Article/CJFDTOTAL-XBSZ201304021.htm
[22] 傅旭东, 王光谦.低浓度固液两相流中的粗颗粒浓度分布[J].清华大学学报(自然科学版), 2002, 42(10):1361-1364. http://www.cnki.com.cn/Article/CJFDTOTAL-QHXB200210022.htm Fu X D, Wang G Q. Concentration distribution of coarse particles in dilute solid/liquid two-phase floes[J]. Journal of Tsinghua University (Science & Technology), 2002, 42(10):1361-1364. http://www.cnki.com.cn/Article/CJFDTOTAL-QHXB200210022.htm
[23] 赵利安, 孟庆华.伴有滑动床的浆体倾斜管道摩阻损失研究[J].矿业研究与开发, 2008, 28(2):3-6. http://www.cnki.com.cn/Article/CJFDTOTAL-KYYK200802004.htm Zhao L A, Meng Q H. Research on friction loss of slurry with sliding bed in inclined pipeline[J]. Mining Research and Deve-lopment, 2008, 28(2):3-6. http://www.cnki.com.cn/Article/CJFDTOTAL-KYYK200802004.htm
[24] Shook C A, Roco M C. Slurry flow:principles and practice[M]. Oxford:Butterworth-Heinemann, 1991:123-124.
[25] 张士林, 许振良, 邵龙潭.弓形断面管道的紊流速度分布[J].辽宁工程技术大学学报, 2006, 25(1):63-65. http://www.cnki.com.cn/Article/CJFDTOTAL-FXKY200601019.htm Zhang S L, Xu Z L, Shao L T. Water velocity in pipe of arching section[J]. Journal of Liaoning Technical University, 2006, 25(1):63-65. http://www.cnki.com.cn/Article/CJFDTOTAL-FXKY200601019.htm
[26] Hisham A N, Shook C A, Nabil E. Isokinetic probe sampling from slurry pipelines[J]. The Canadian Journal of Chemical Engineering, 1984, 62(2):179-185. DOI: 10.1002/cjce.v62:2
[27] 赵利安, 姜威.粗颗粒高浓度流体管道流动浓度分布研究[J].泥沙研究, 2016, (1):37-41. http://www.cnki.com.cn/Article/CJFDTOTAL-NSYJ201601007.htm Zhao L A, Jiang W. Study on concentration distribution of pipe flow with high concentration coarse particles[J]. Journal of Sediment Research, 2016, (1):37-41. http://www.cnki.com.cn/Article/CJFDTOTAL-NSYJ201601007.htm


计量
- 文章访问数: 217
- HTML全文浏览量: 131
- PDF下载量: 6